Kefir Connect
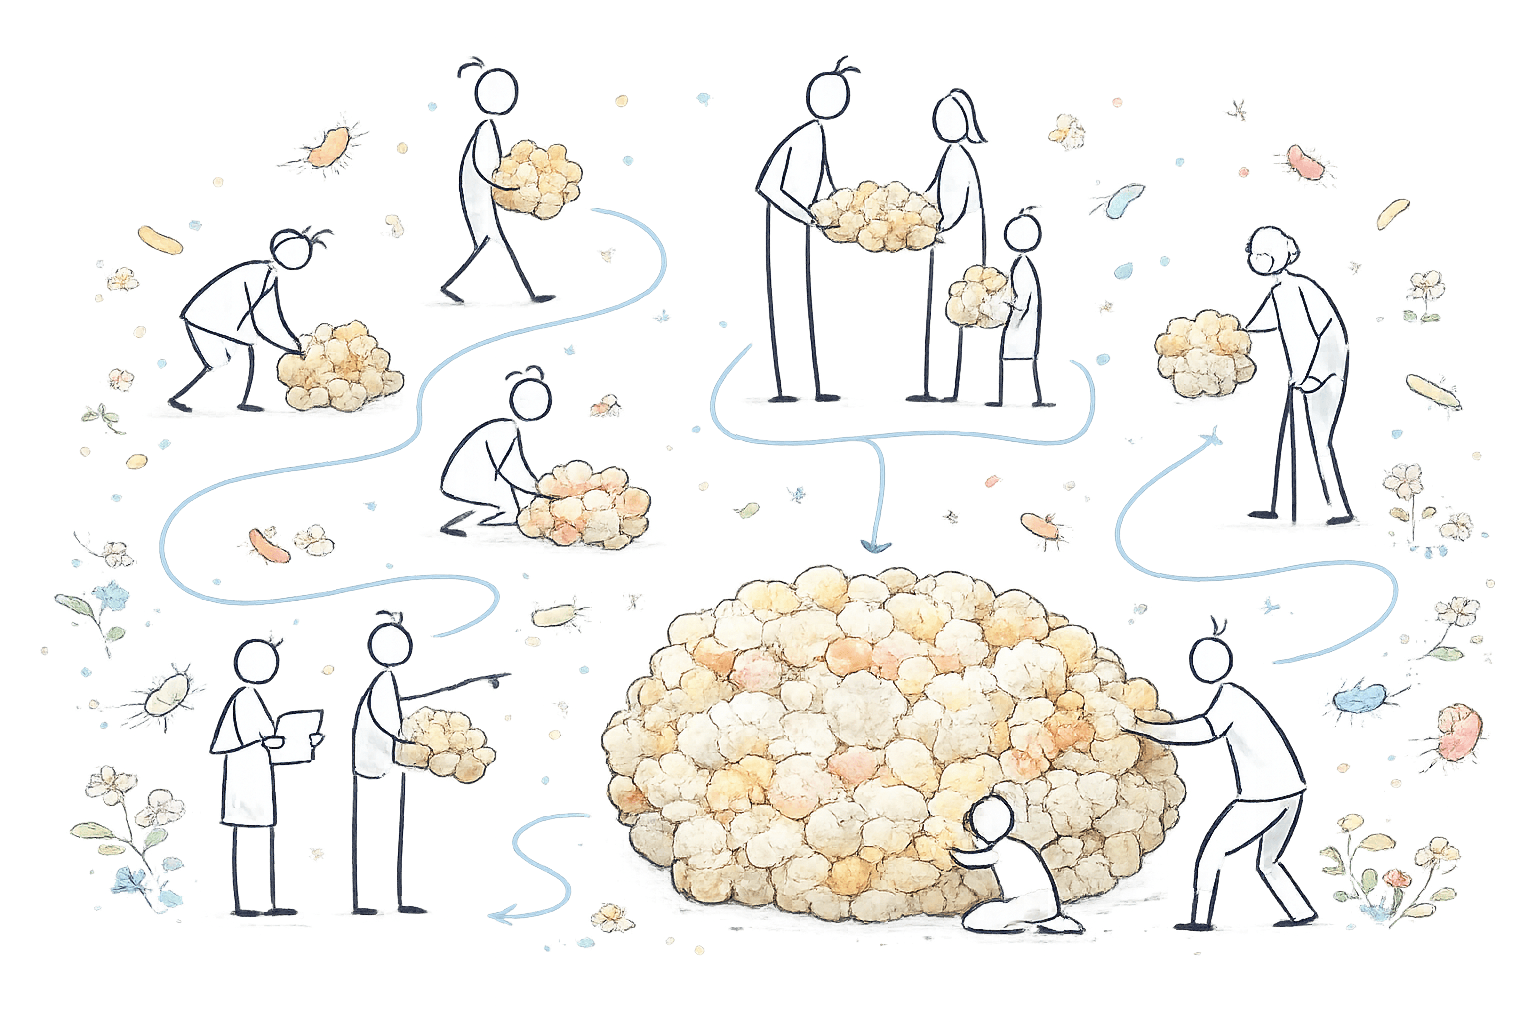
KefirConnect is a citizen science project that explores the diversity, distribution, and transmission of water kefir cultures through interactive mapping and community participation.
Our current projects map the future: interdisciplinary work, evolving aims, and collective exploration.
KefirConnect is a citizen science project that explores the diversity, distribution, and transmission of water kefir cultures through interactive mapping and community participation.

SynoSys, along with a consortium of leading researchers, has secured funding for the DREAM EP (Data-informed Responsive Epidemic Analysis and Multiscale-Modelling for Epidemic Preparedness) research project in pandemic forecasting.

A major milestone for SynoSys: We have been awarded €2.3 million in funding from the Federal Ministry of Health (BMG) for the SynoSys.PC project, aimed at advancing the understanding of Long-COVID and advancing patient care.

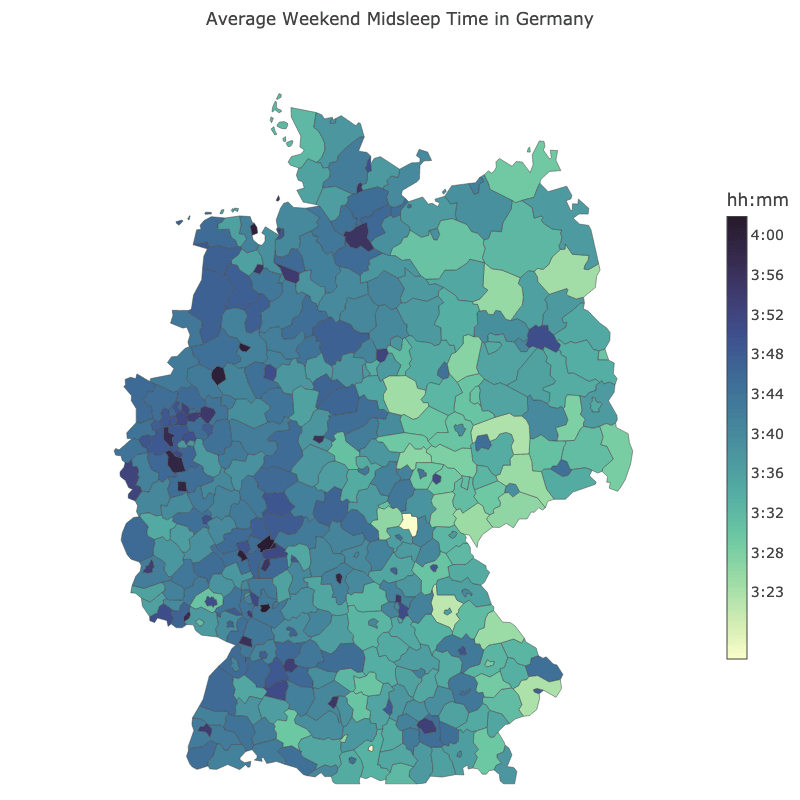
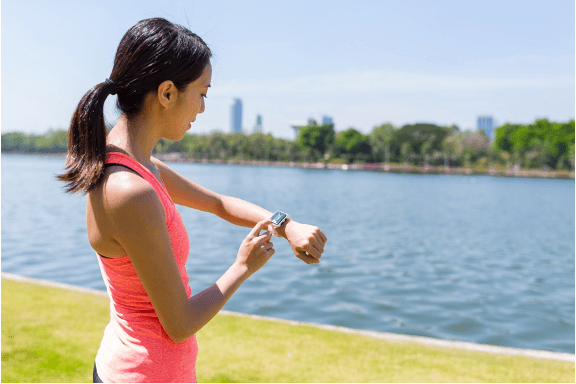
We perform comprehensive spatiotemporal analyses of sleep patterns in a sample of over 100,000 individuals across Germany spanning almost 3 years. As part of the Robert Koch Institute's Data Donation Project for the early detection of COVID-19, sleep data was collected in a privacy-preserving fashion by passive sensors in consumer wearable devices.

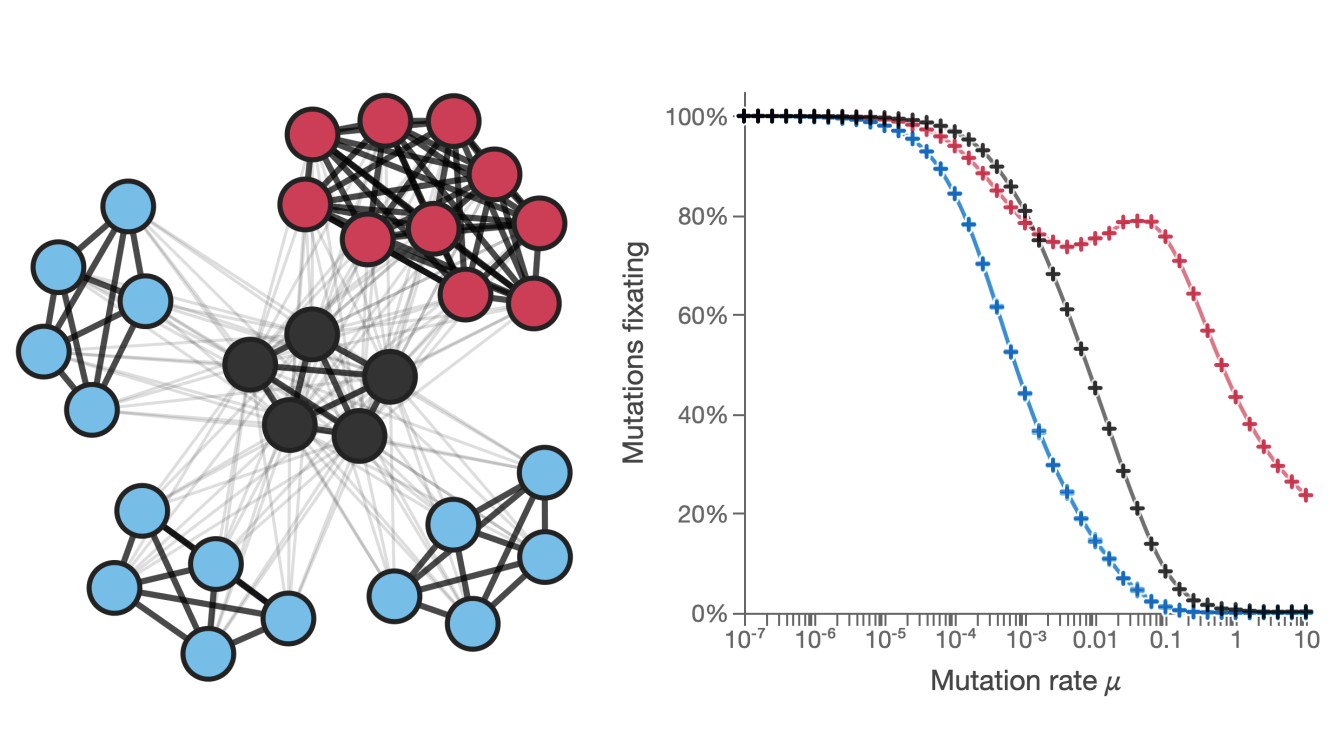
Understanding how network structures interact with the evolution of competing lineages in clonal populations.

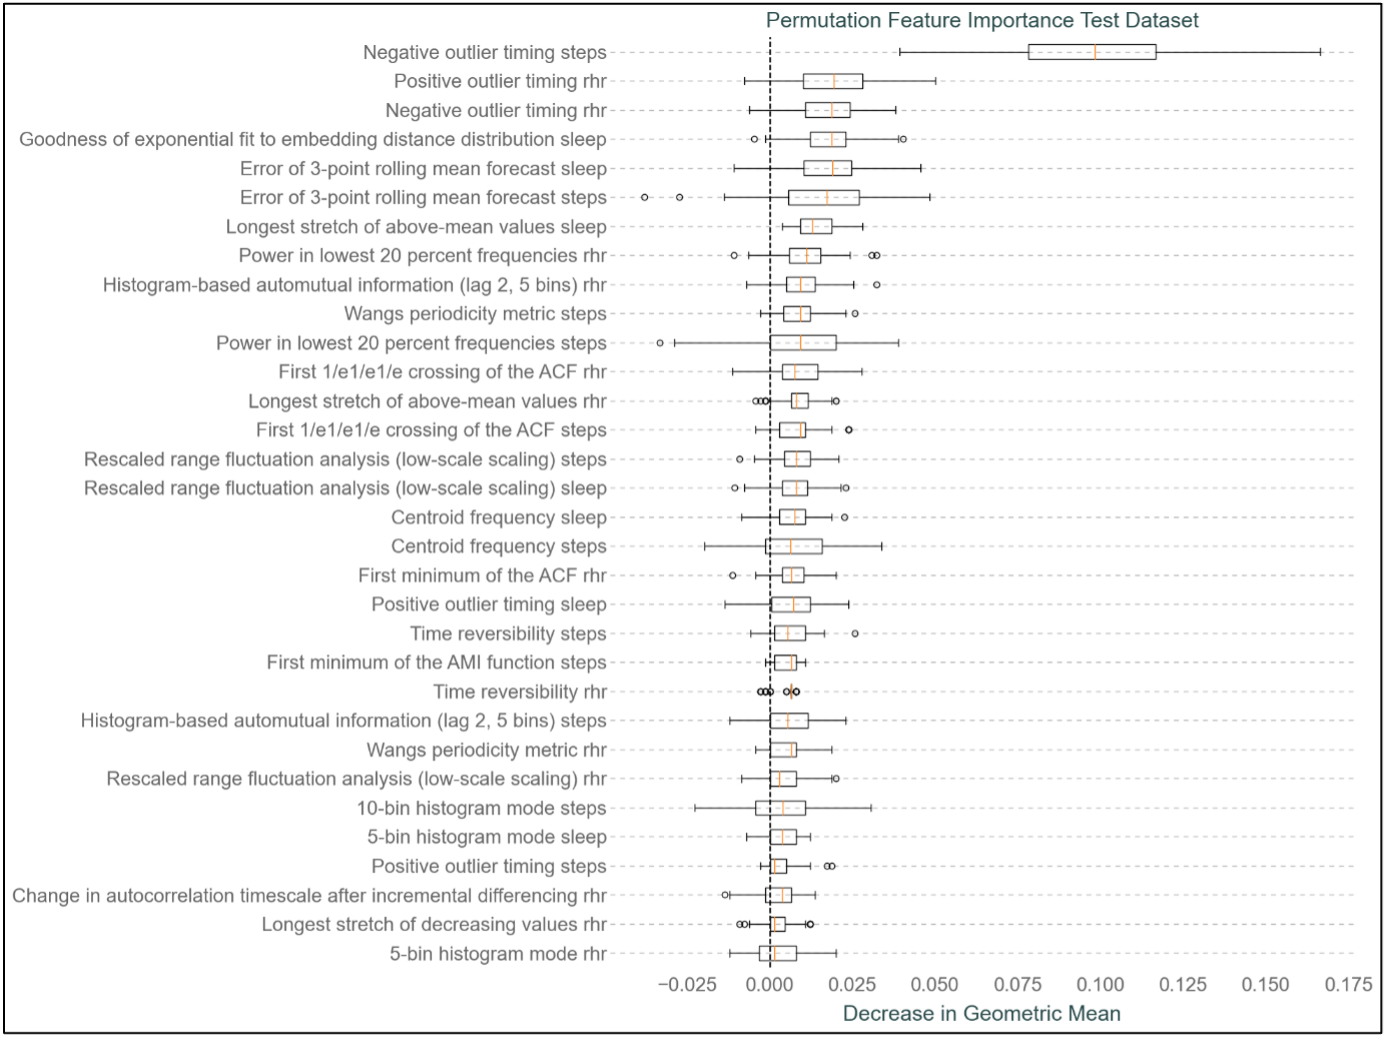
Machine learning-based COVID-19 detection using wearable sensor data such as resting heart rate, sleep duration, and step count, leveraging interpretable catch22 features and logistic regression models.

FEDORA - Federated Network Modeling of Ecological Complex Dynamical Patterns in Post-COVID aims to advance the understanding of how ecological systems are affected by complex dynamical patterns emerging in the aftermath of the COVID-19 pandemic.

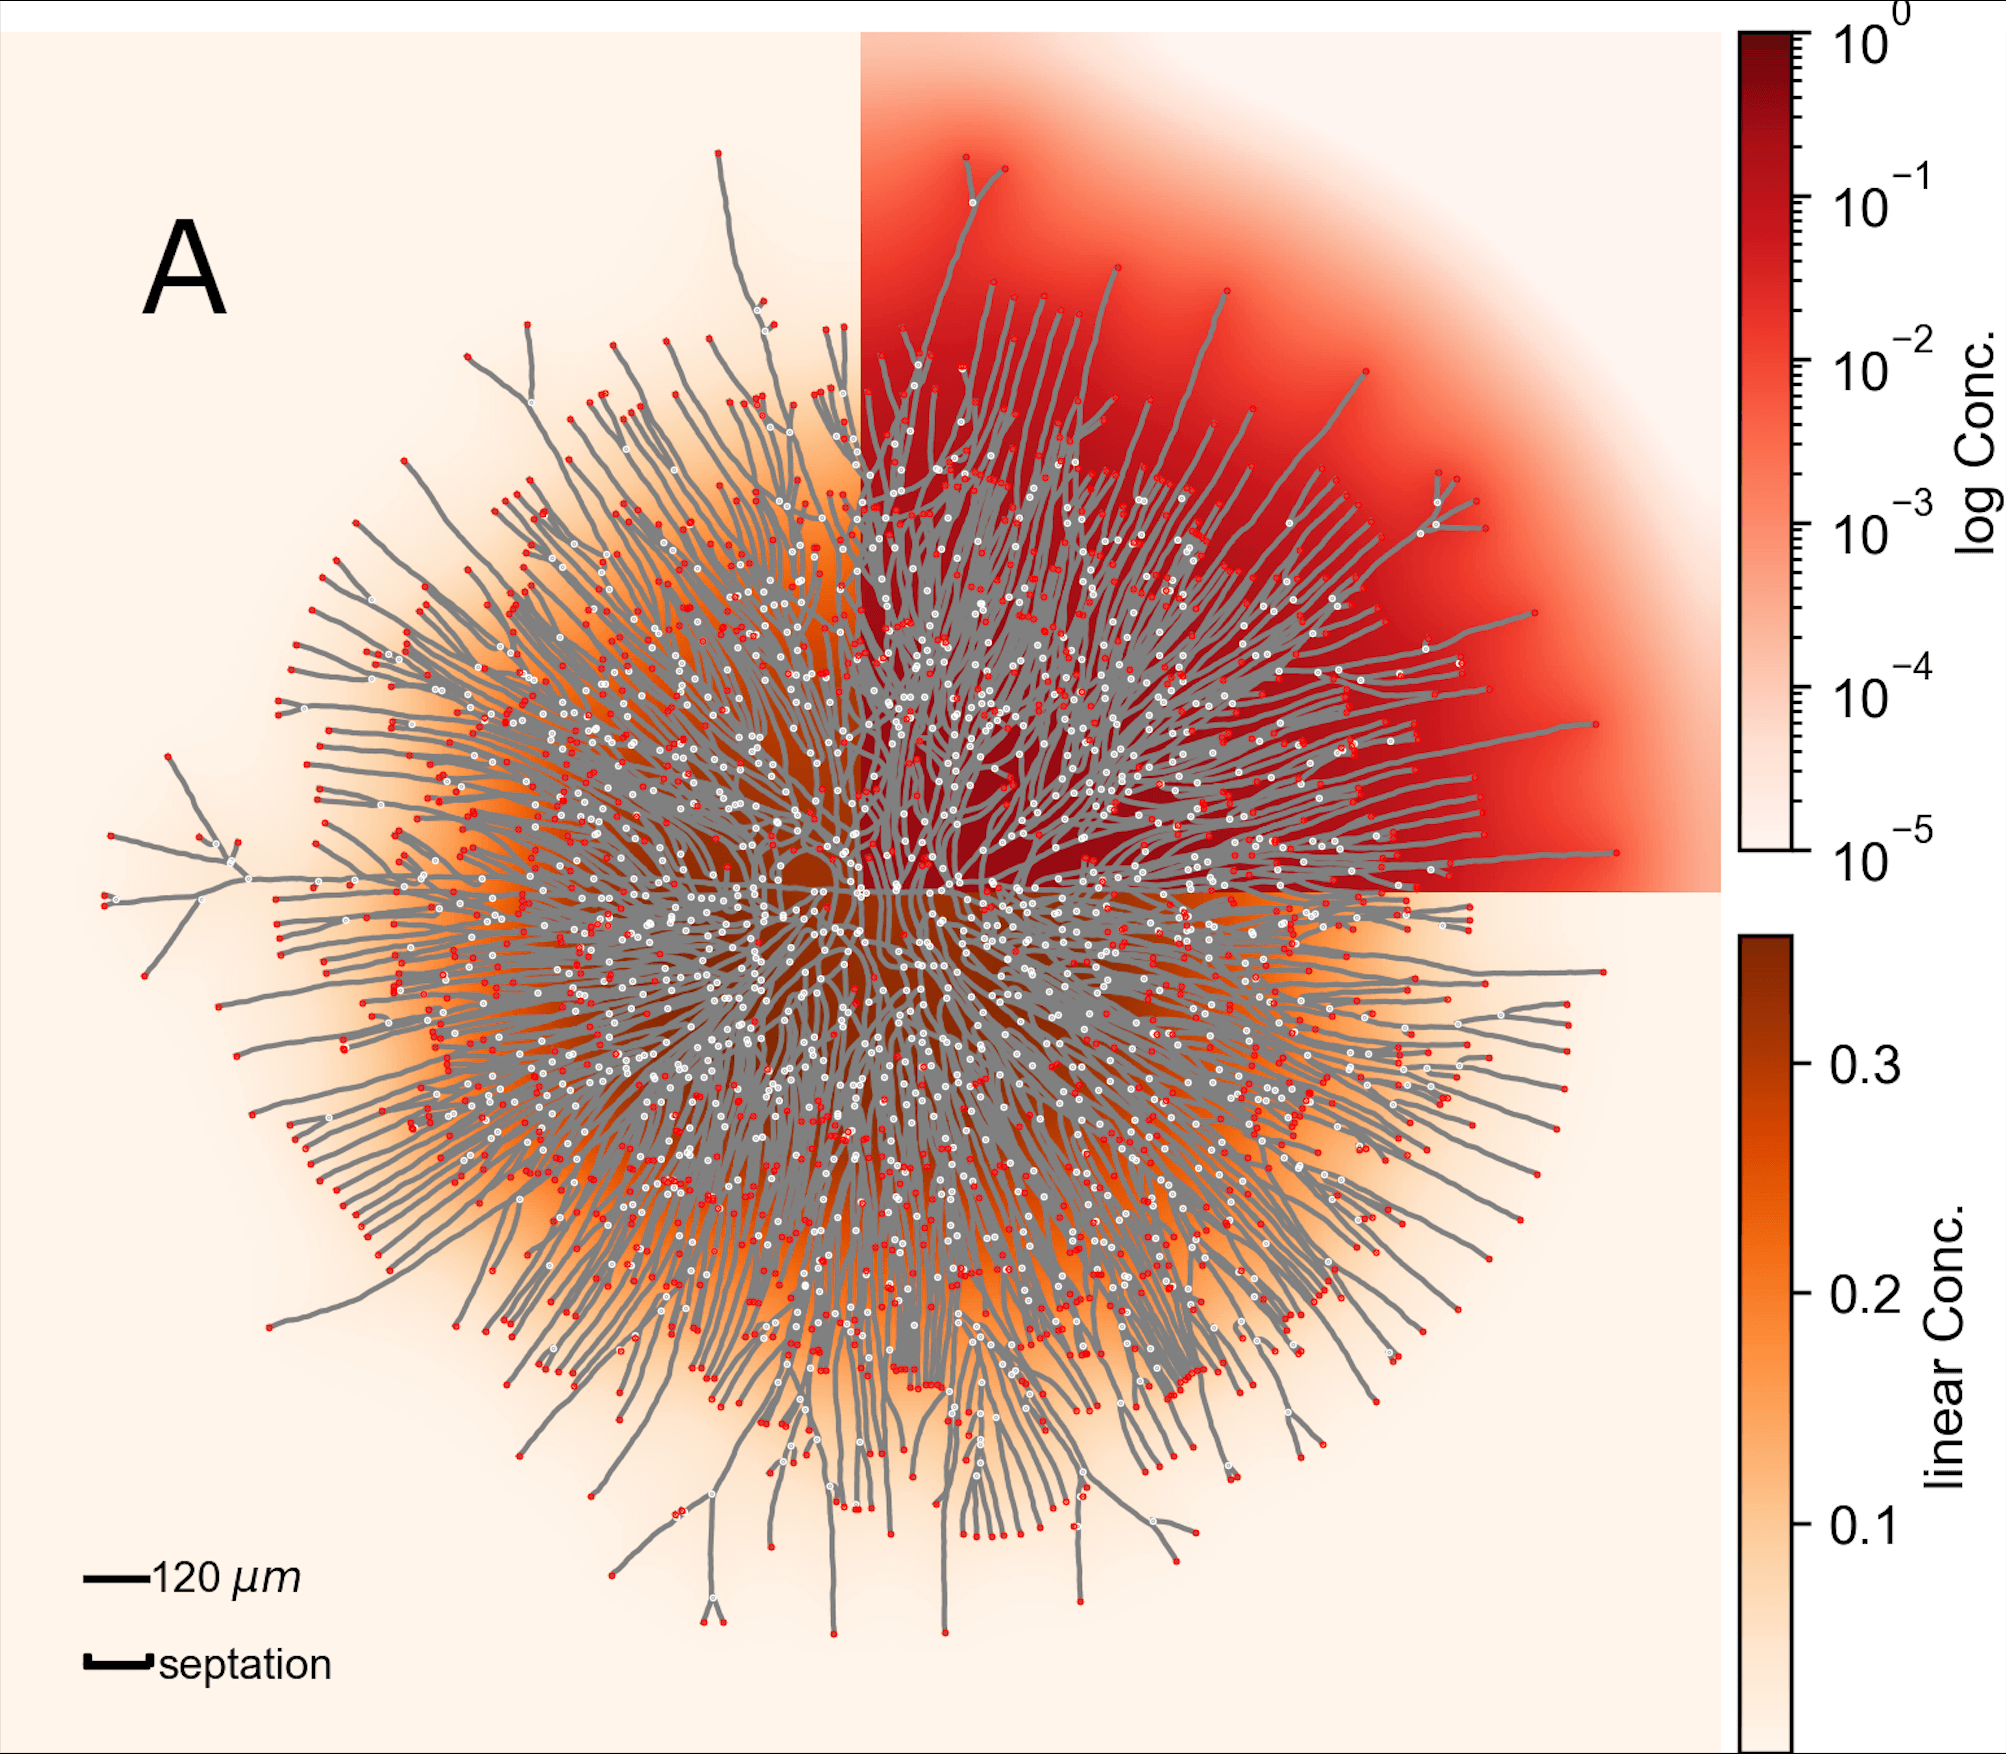
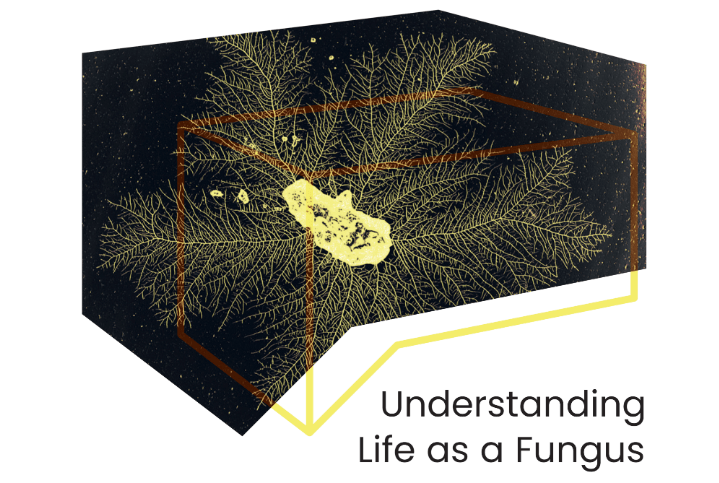
The key players in ecosystems are fungi. In this project, we investigate the growth of filamentous fungi by creating and investigating mathematical growth models in cooperation with experimental biologists.

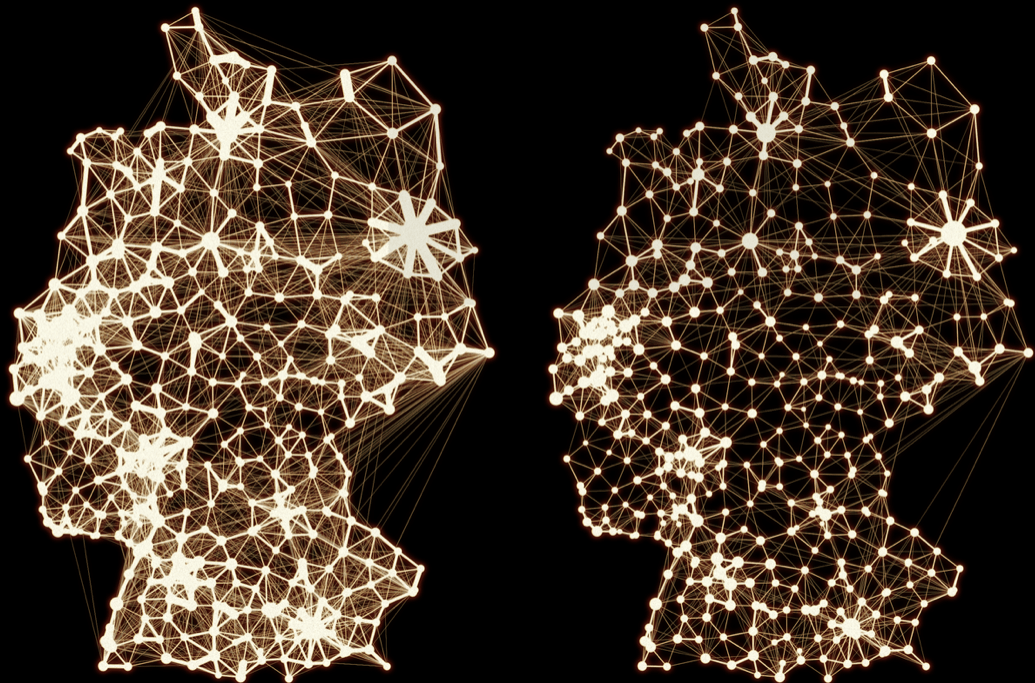
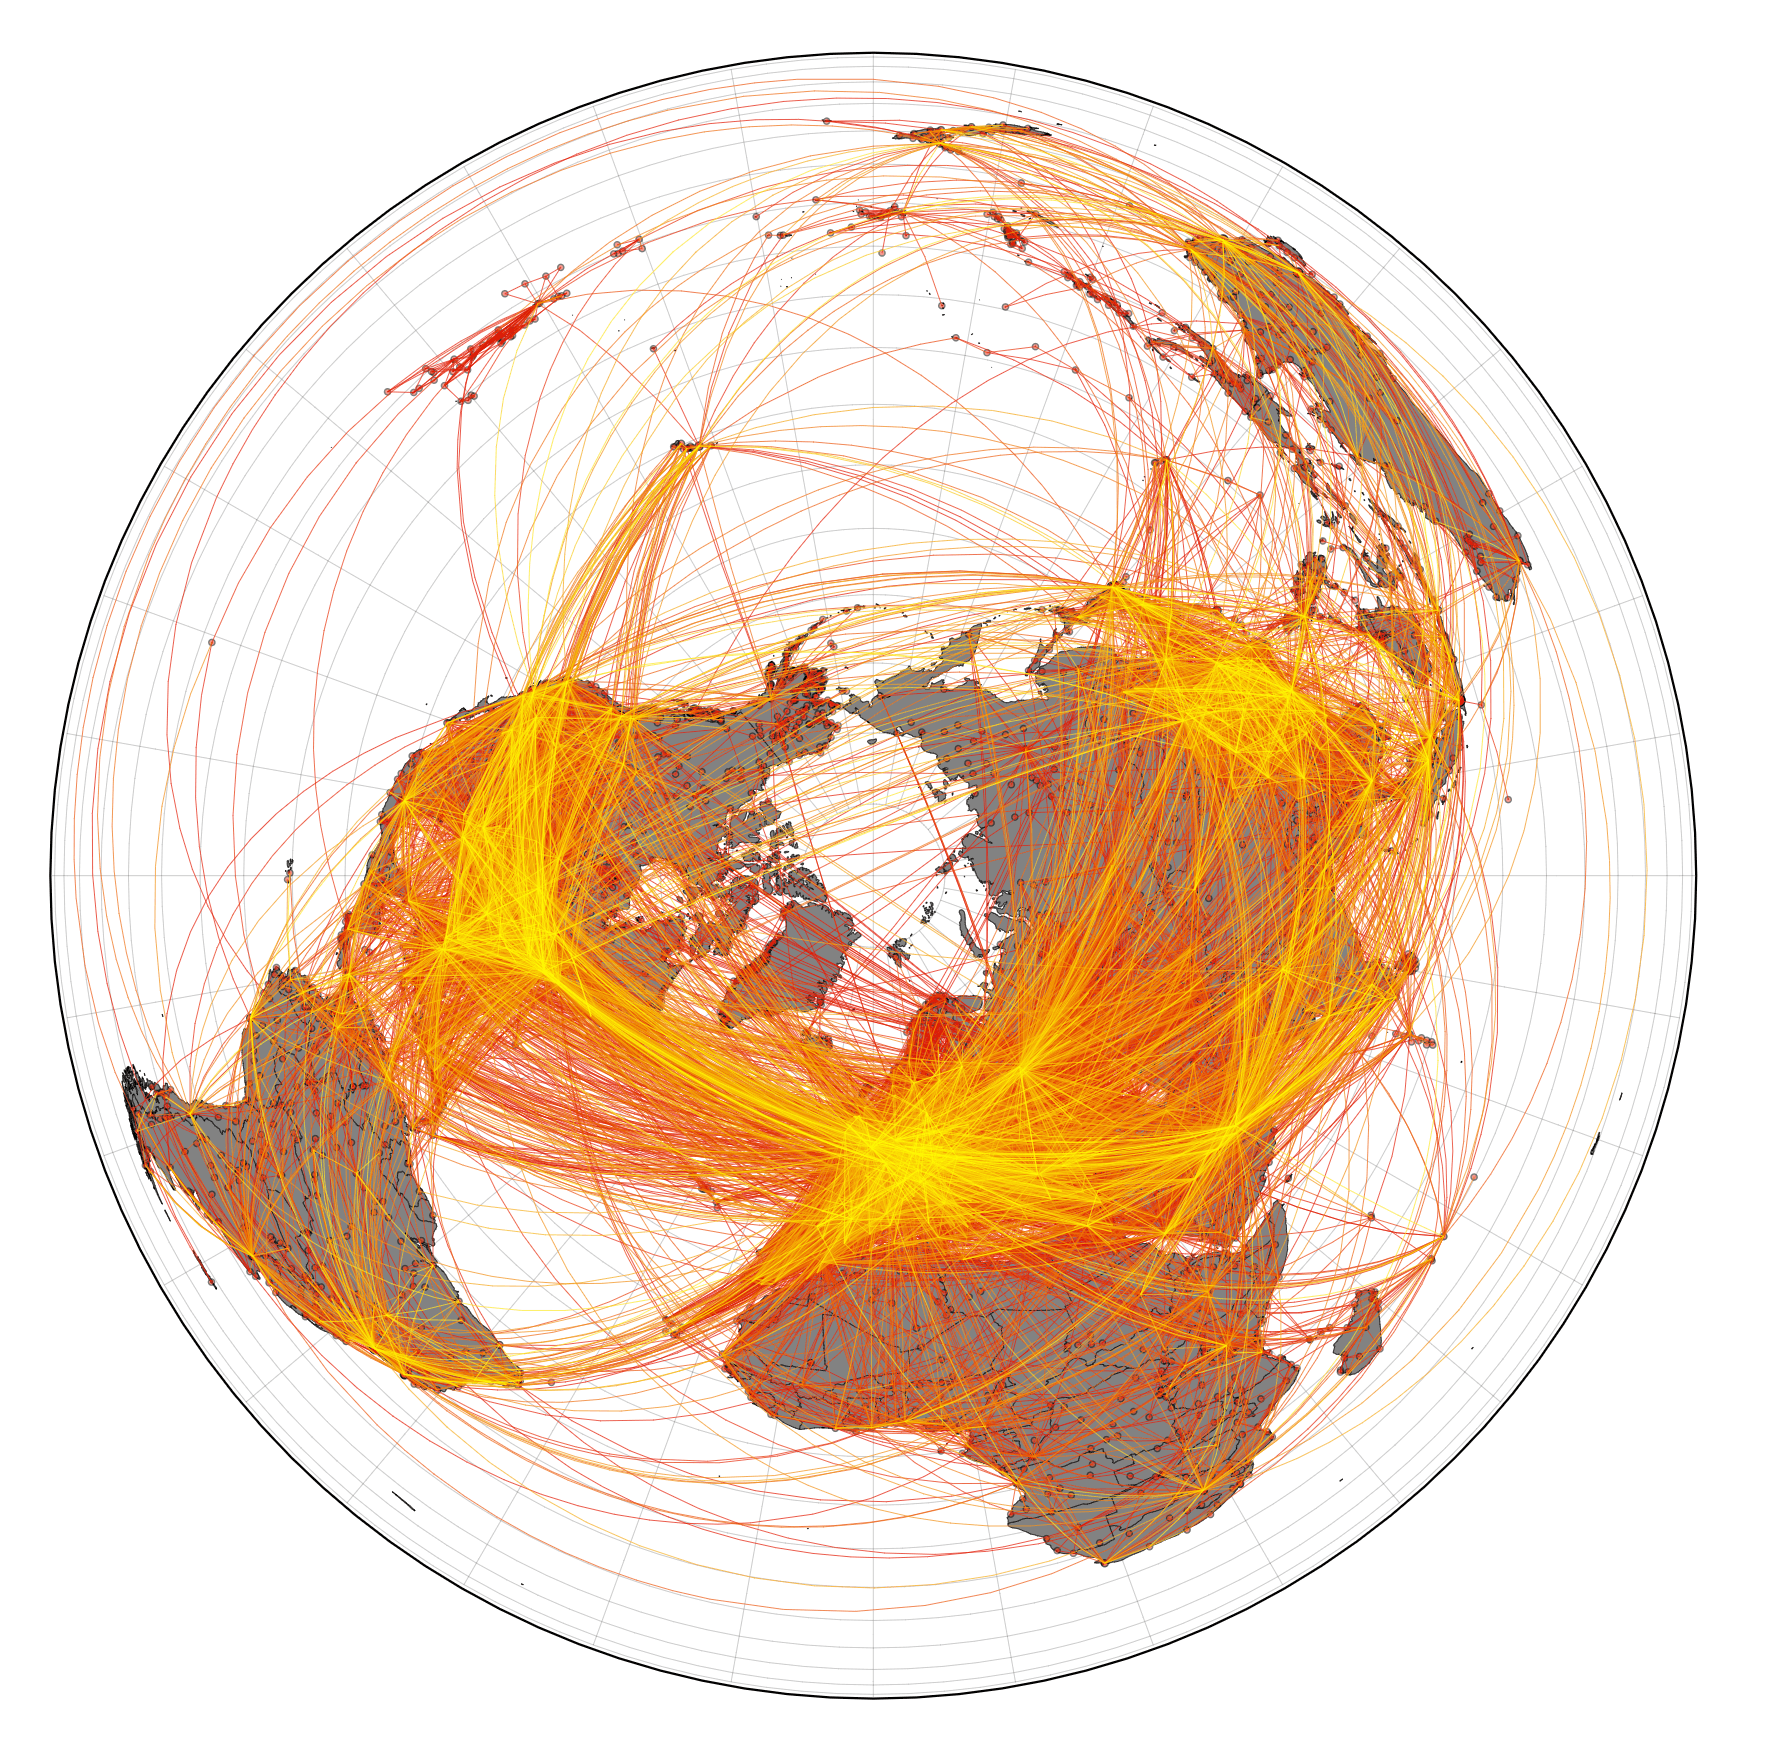
This project crosses the fields of network science, transportation, mobility and disease dynamics. It uses effective distance based on mobility between regions to predict pandemic spread patterns on the worldwide air transportation network.

Fungi grow by extending microscopic threads called hyphae, forming intricate networks known as mycelium. Without eyes, brains, or centralized control, they explore their environment with surprising intelligence. This exhibit transforms time-lapse imagery of fungal growth into visual datasets, revealing diverse growth patterns—from geometric structures to chaotic spirals. By studying these behaviors, we aim to uncover how fungi experience the world and how their strategies might inspire innovations in smart materials and transport systems.

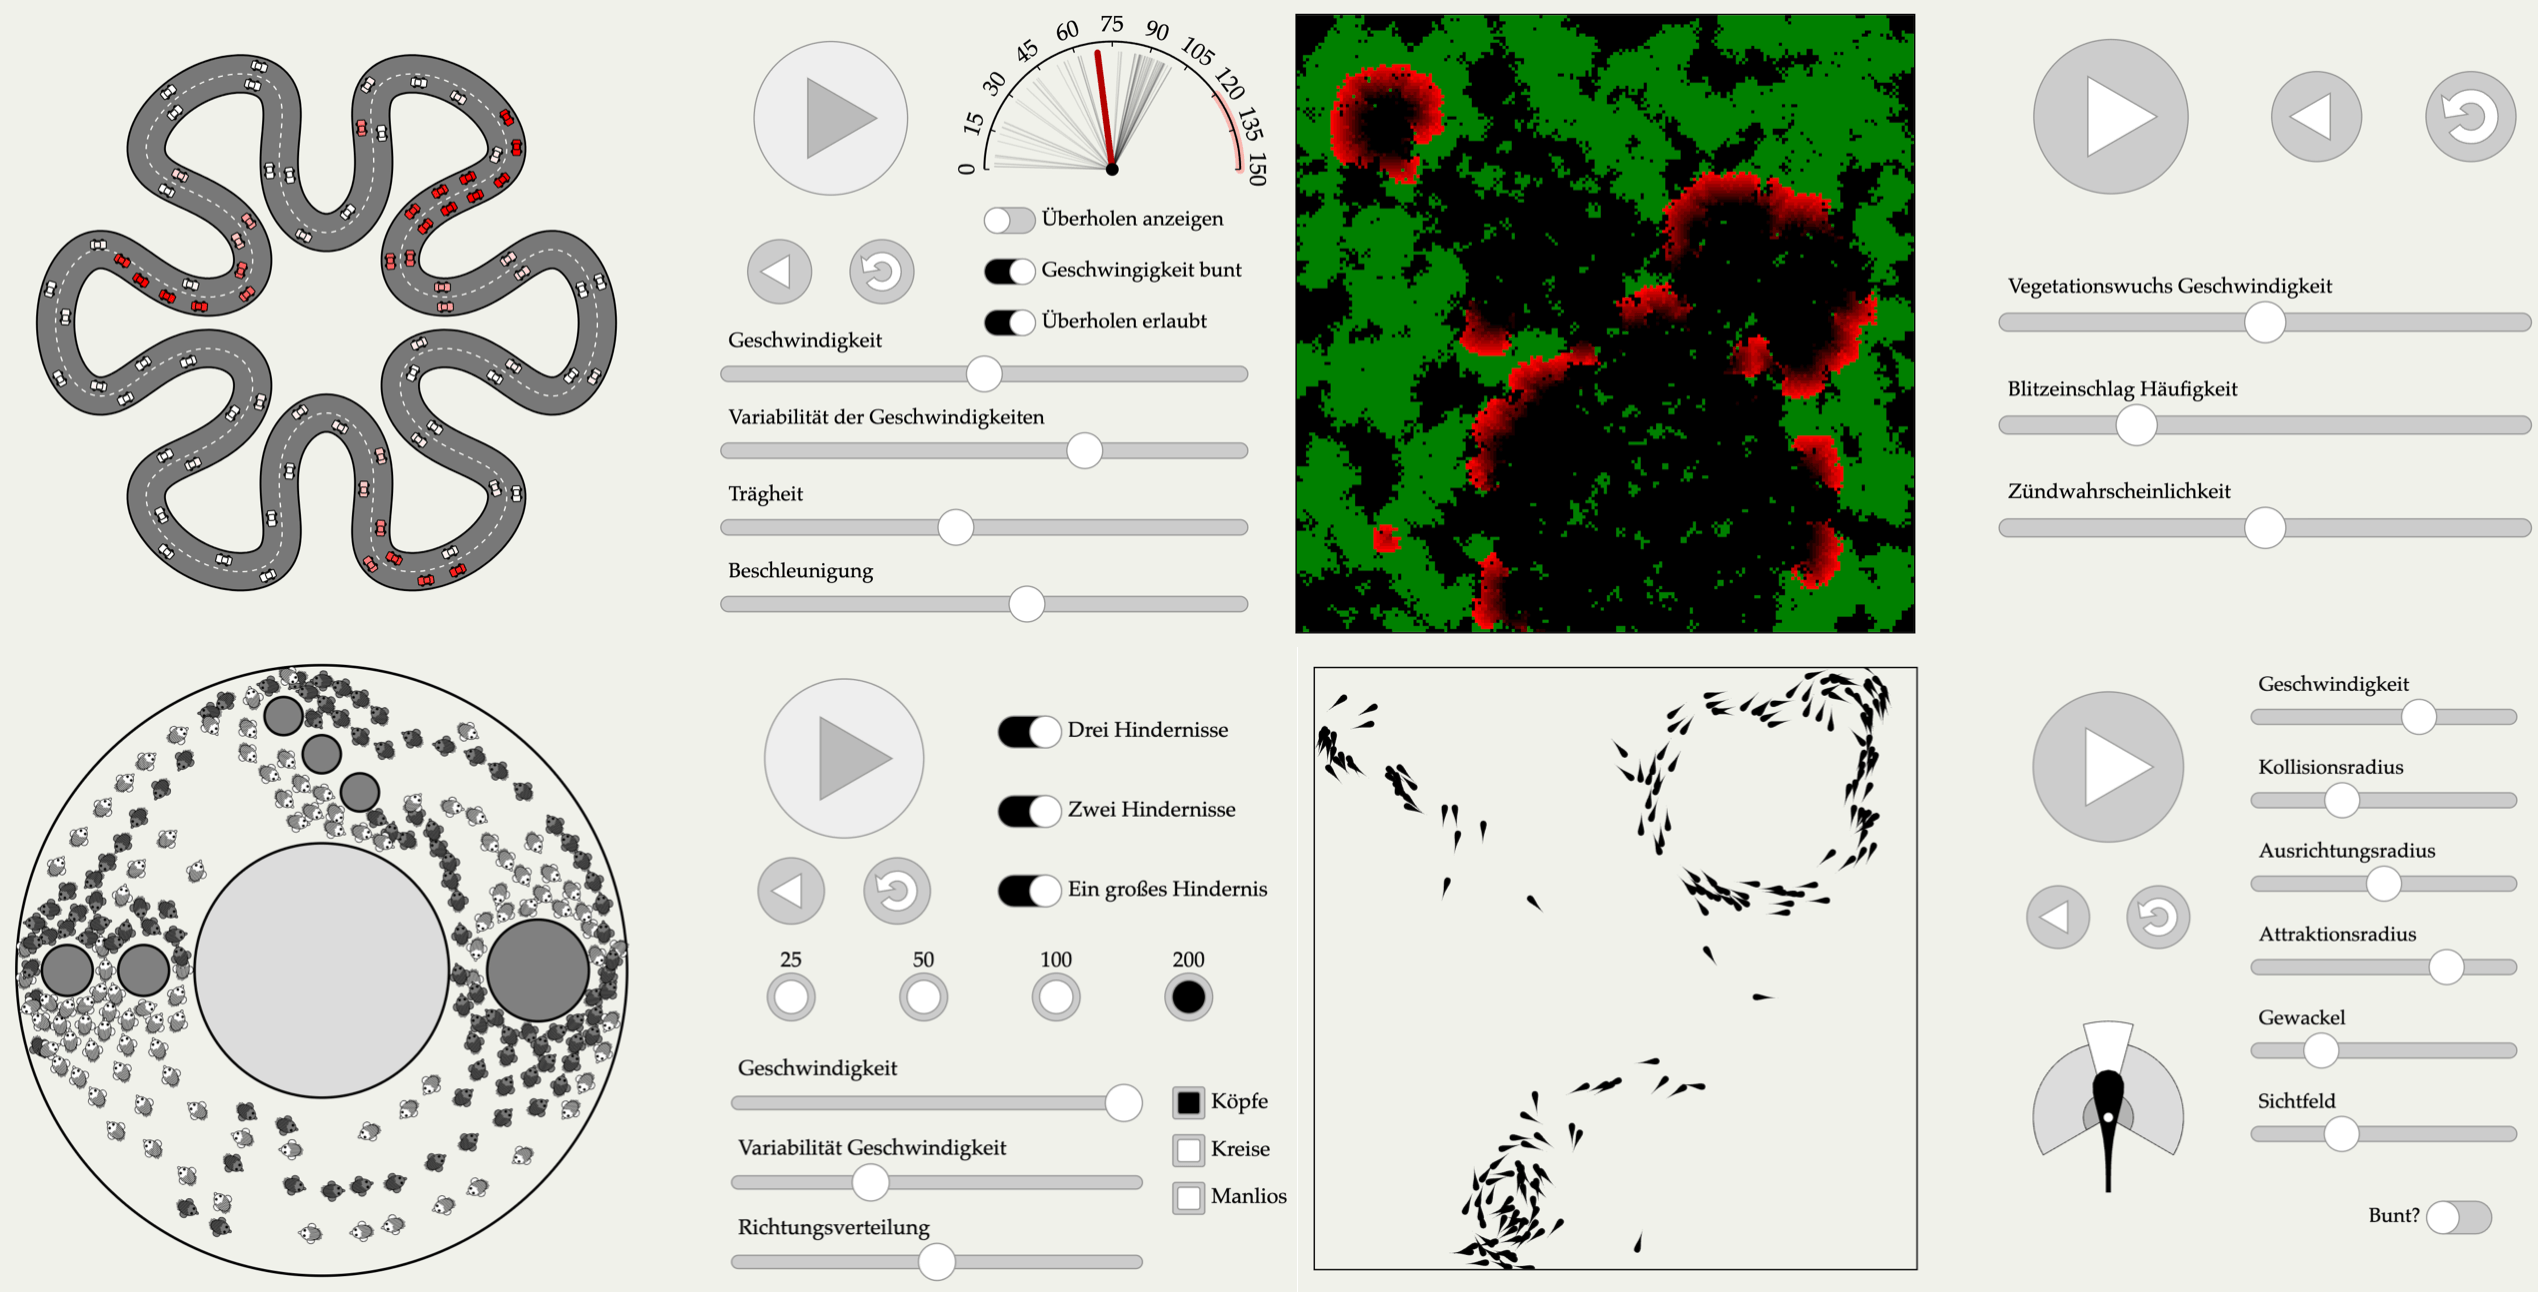
The interdisciplinary research center Department Speculative Transformation of TUD Dresden University of Technology launched the "Designing Futures Together: Visionary Realities" at the Cosmo Science Forum. The exhibition was open from April to Juli, 2024. We provided an interactive visualization exhibit with a selection of Complexity Explorables. Have a look at what people saw at the exhibition.

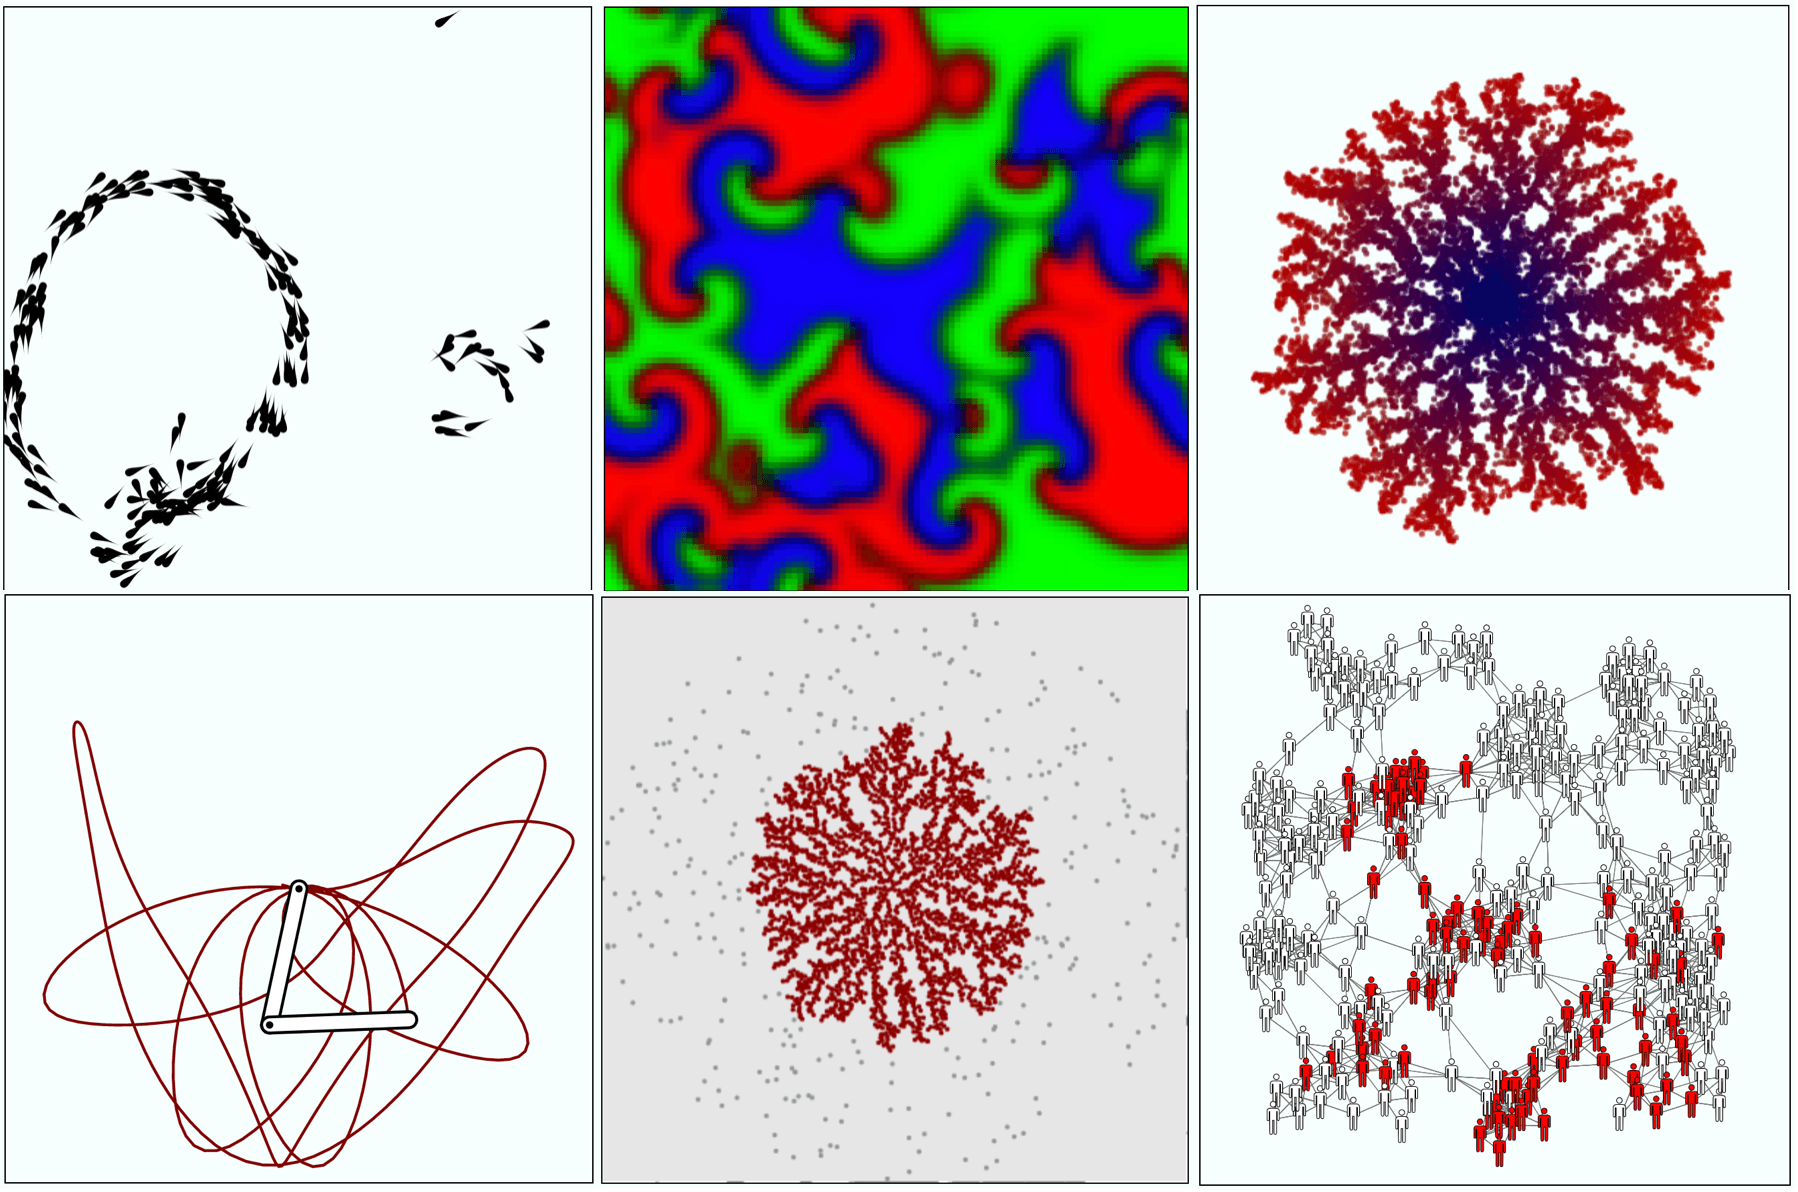
This project is designed for people interested in complex systems and complex dynamical processes. Complexity Explorables hosts different collections of interactive illustrations of models for complex systems in physics, mathematics, biology, chemistry, social sciences, neuroscience, epidemiology, network science and ecology. Topics include pattern formation, synchronization, critical phenomena, chaotic dynamics, evolutionary dynamics, fractals, collective behavior, reaction-diffusion systems and more.

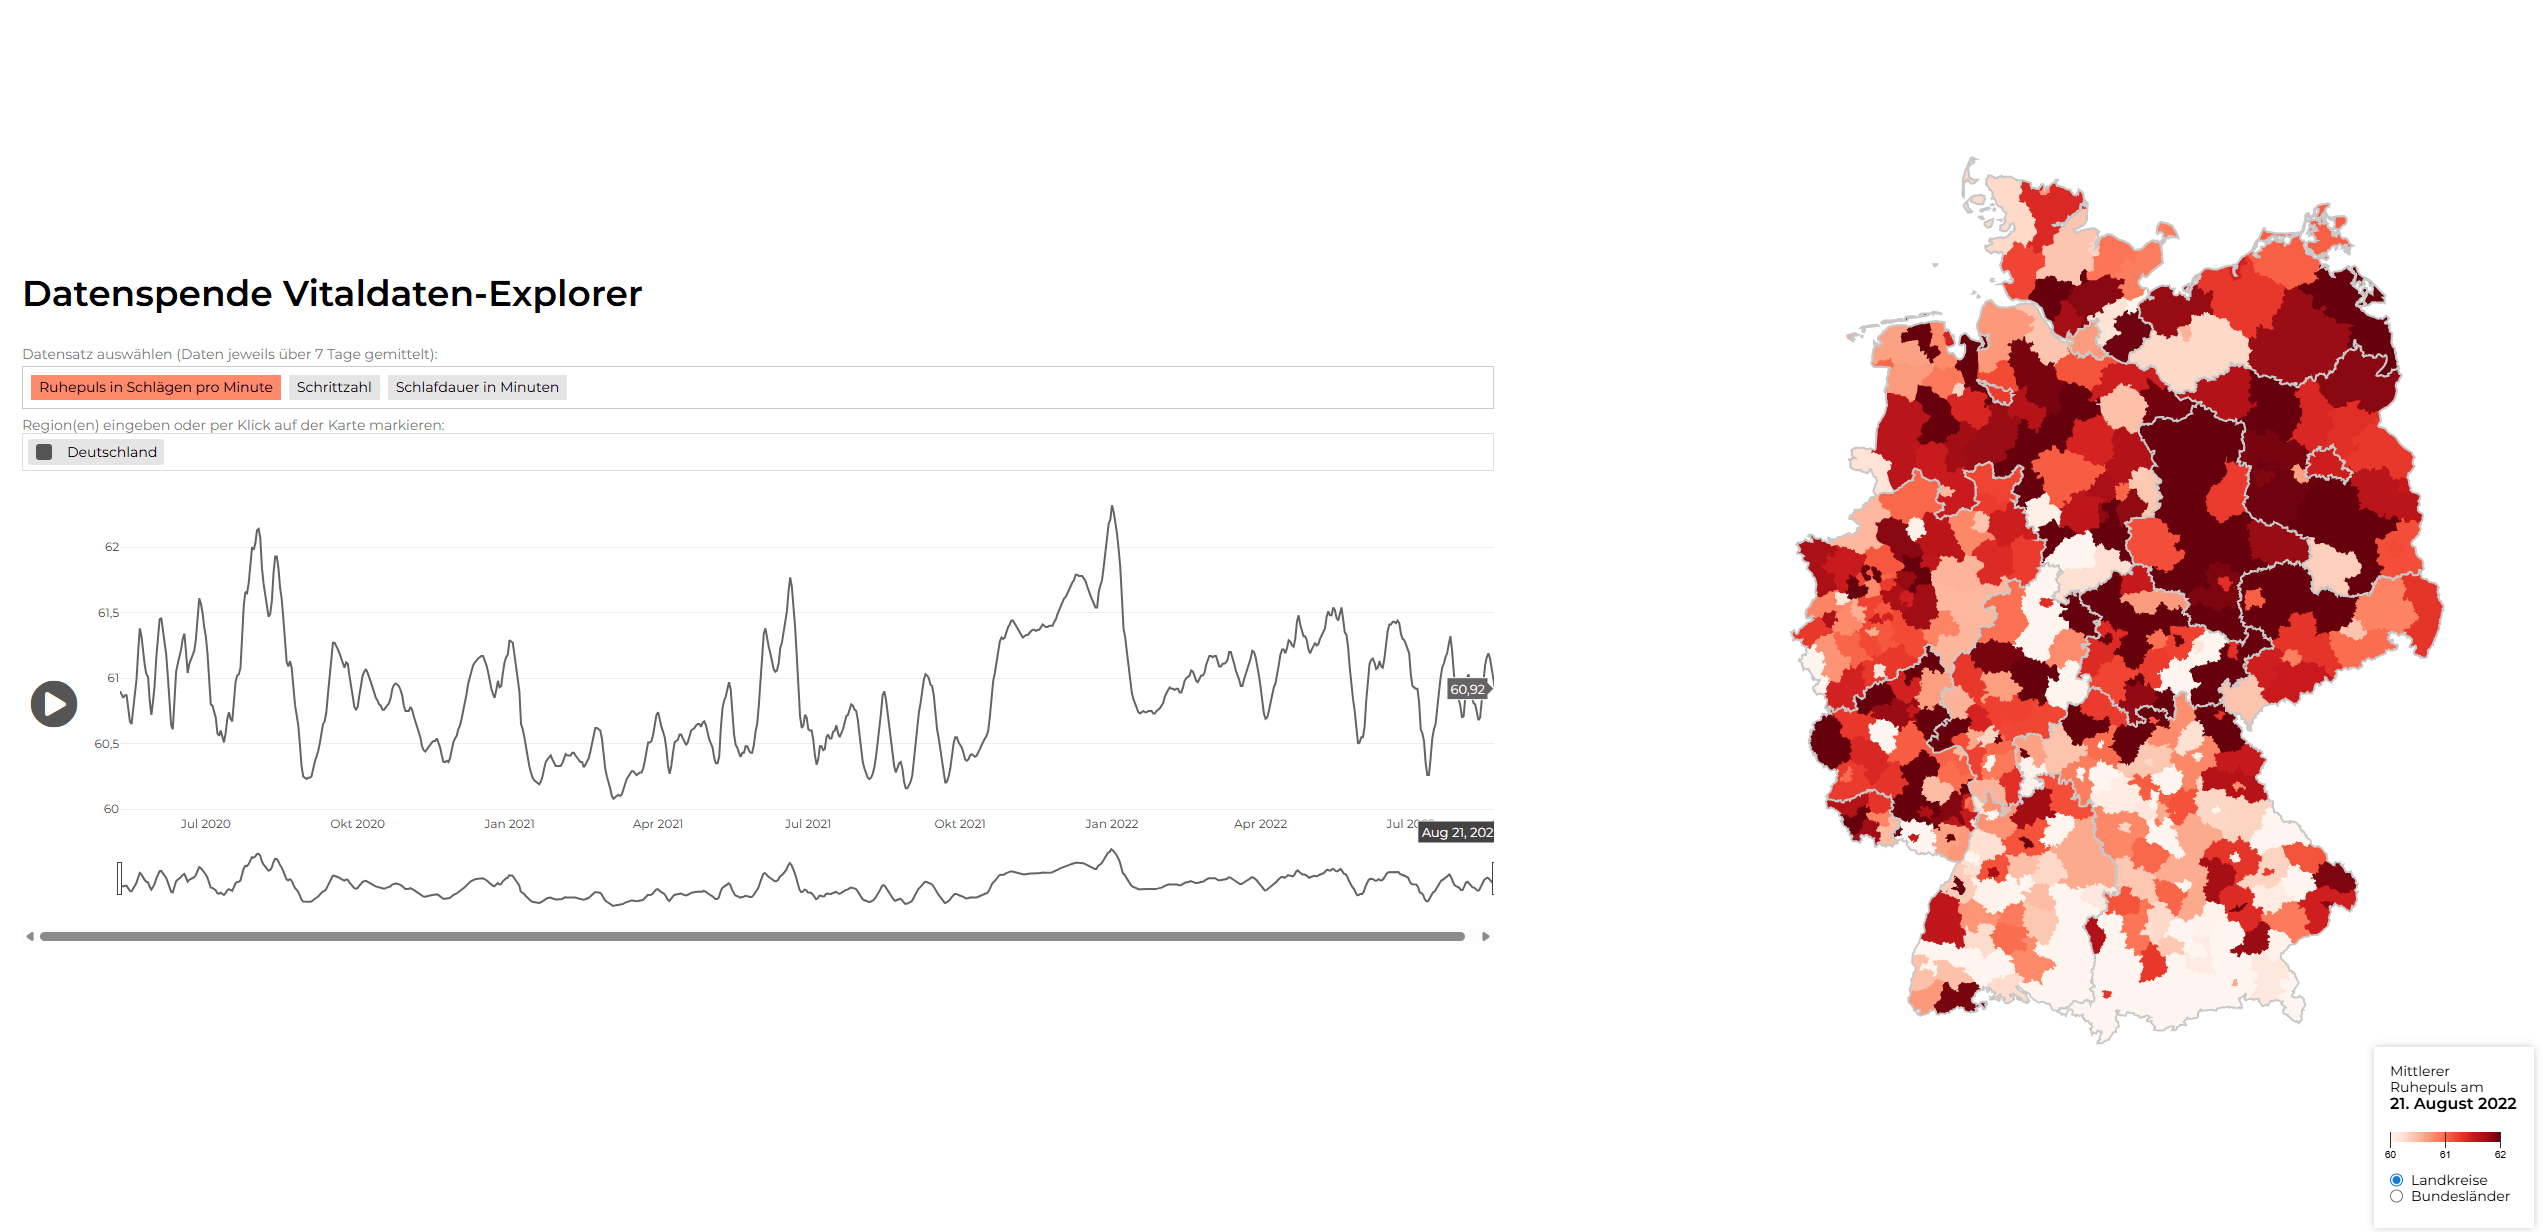
This interactive visualization explores vital health data from the Corona Data Donation project. The tool allows users to analyze aggregated health metrics including resting heart rate, step count, and sleep duration across different regions in Germany. Data is presented as 7-day averages and can be explored at various administrative levels from the entire country down to individual districts.

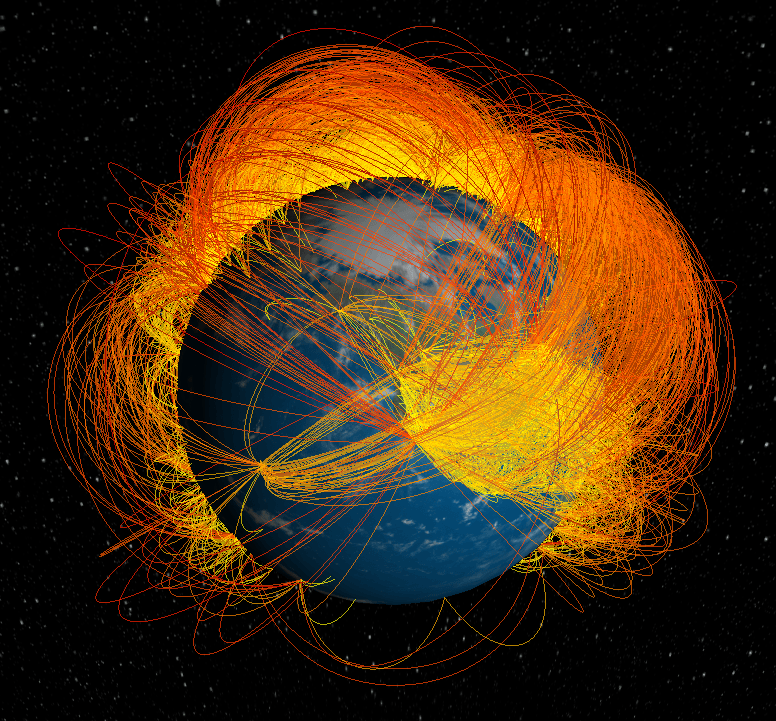
This interactive visualization illustrates the worldwide air-transportation network. The network connects approx. 4000 airports globally with roughly 51.000 connections. On this network more than 3 billion passengers travel each year. In total, humanity travels a total distance of over 15 million kilometers every day (under normal conditions), that is roughly three times the radius of our solar system.

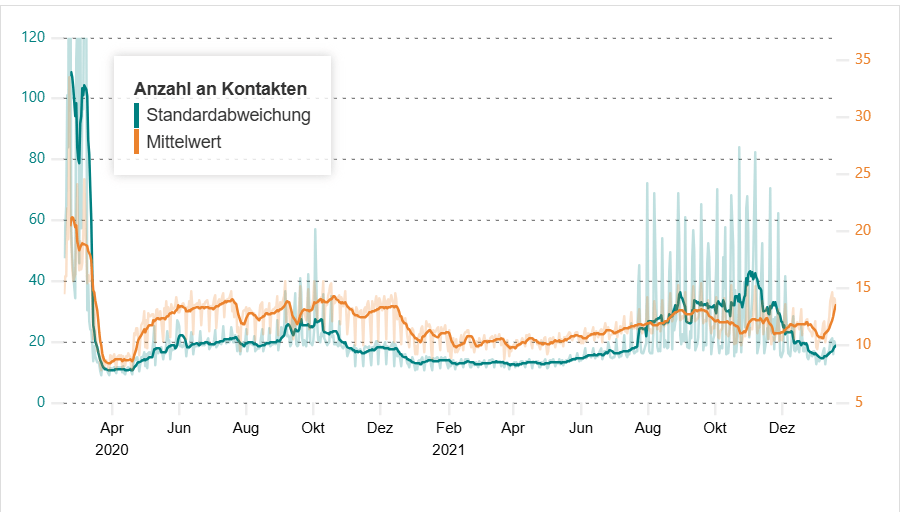
How a pandemic develops depends on many factors: the biology of the pathogen, its susceptibility to external influences such as humidity and temperature, but most of all it is determined by contacts between individuals: transmissions occur primarily when people have contact with each other. The number of contacts thus gives us an insight into the course of the pandemic. Fewer contacts make it more difficult for the pathogen to spread through the population, whereas more contacts promote rapid spread. In the Contacts Monitor, we show the number of contacts and its variation in Germany over time.

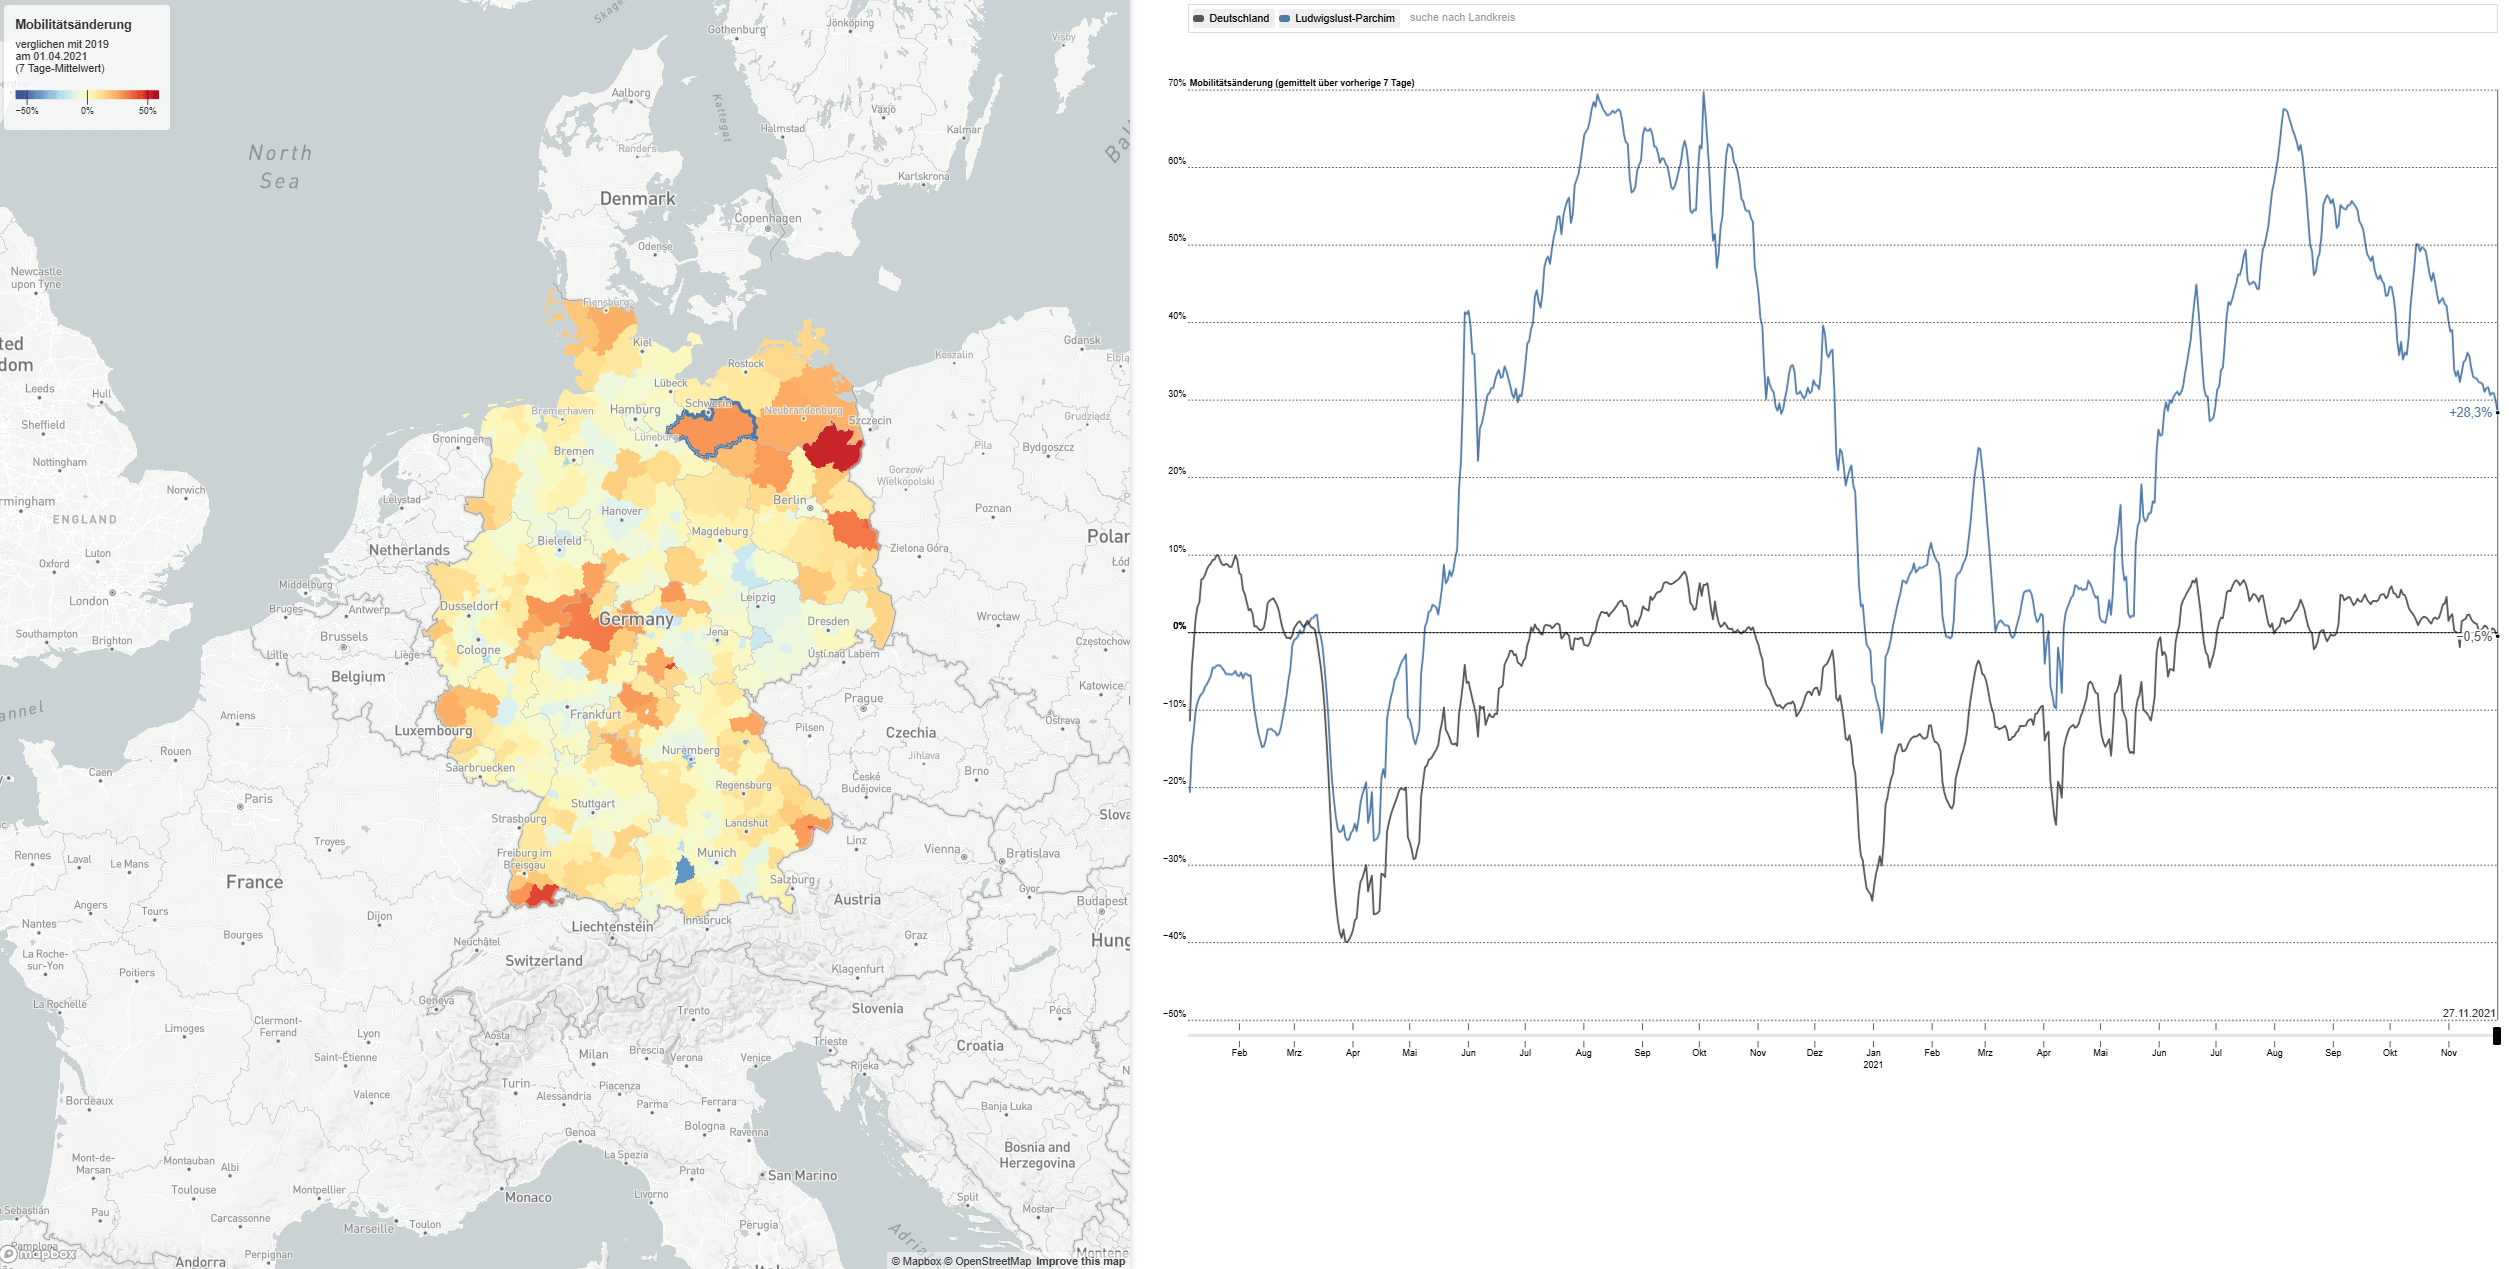
This interactive visualization tool monitors and analyzes mobility patterns across Germany using aggregated and anonymized mobility data. The tool provides insights into regional mobility changes during the COVID-19 pandemic with an interactive map and time-series charts, helping to understand movement patterns and their relationship to public health measures.

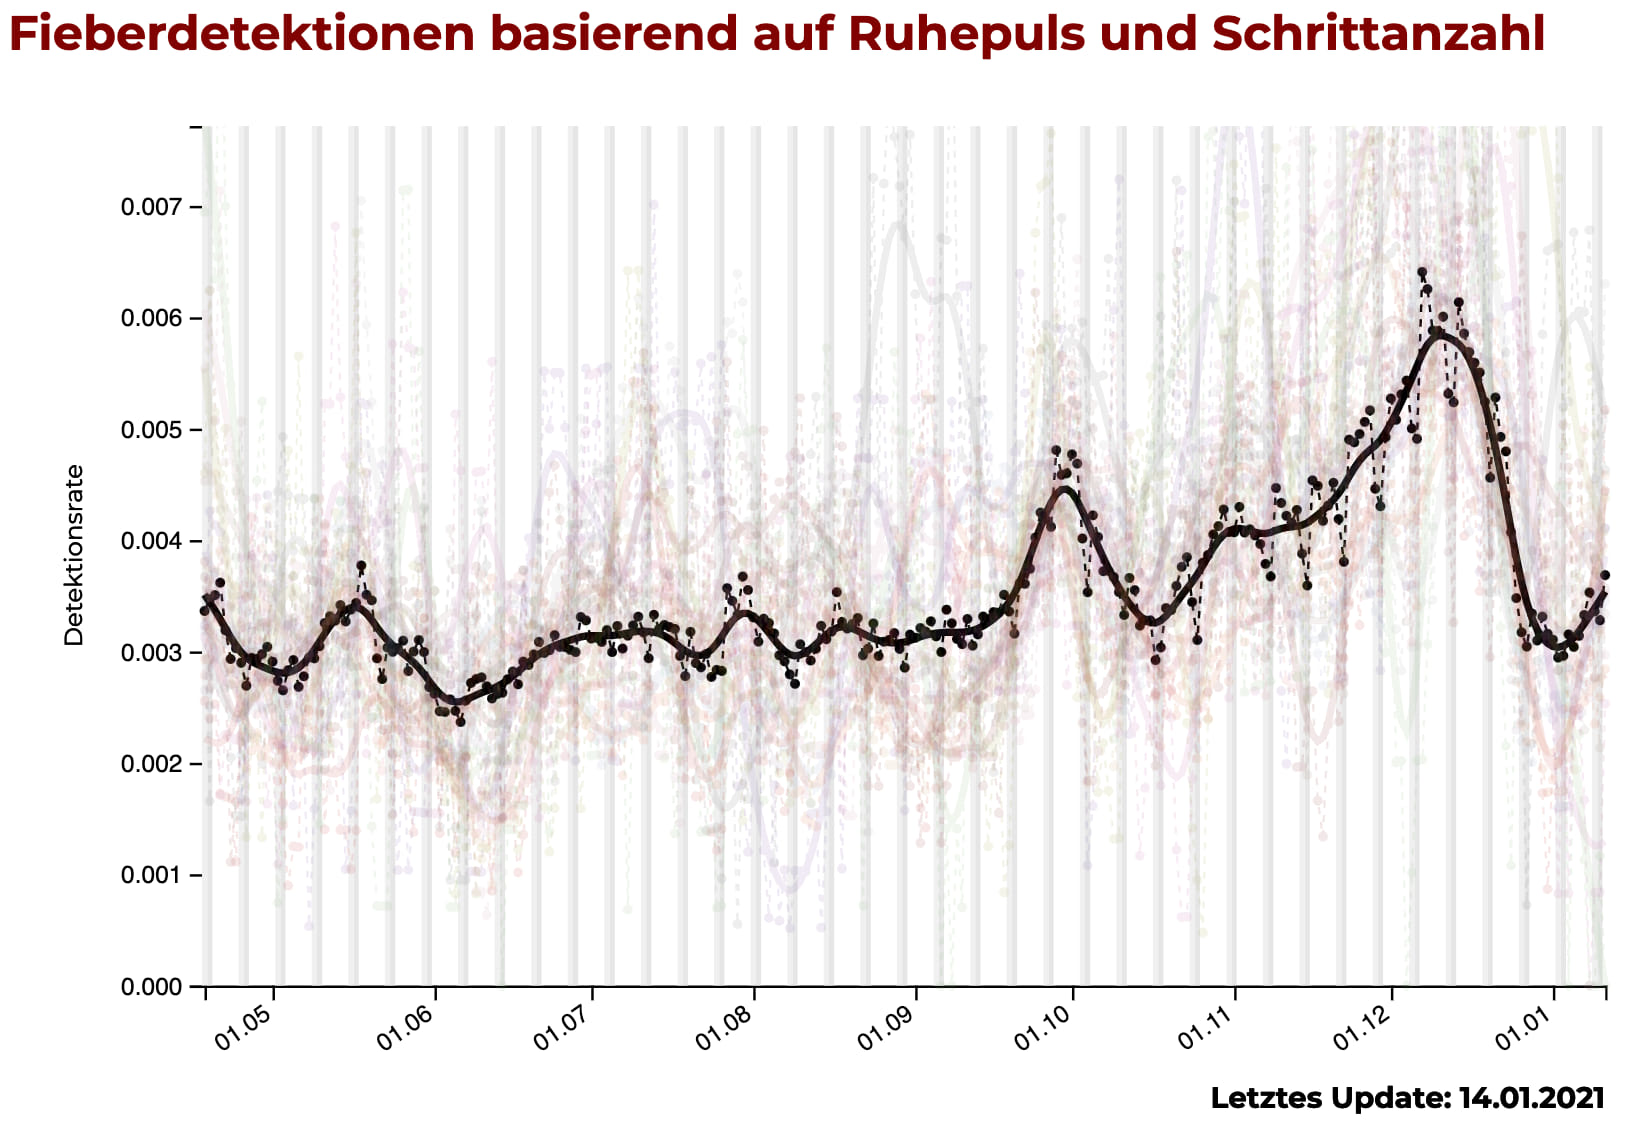
At the beginning of April 2020, we launched the official Corona Datenspende App. Since then, more than 530.000 German inhabitants have volunteered to donate their fitness tracker data. This is the biggest data donation project worldwide. We also calculate daily fever detections by regions and update the live fever monitor.

Fast prototyping of epidemiological models based on reaction equations. Analyze the ODEs analytically or numerically, or run/animate stochastic simulations on networks/well-mixed systems. Simple compartmental models of infectious diseases are useful to investigate effects of certain processes on disease dissemination. Using pen and paper, quickly adding/removing compartments and transition processes is easy, yet the analytical and numerical analysis or stochastic simulations can be tedious to set up and debug—especially when the model changes (ever so slightly).

Simple and interactive network visualization in Python. Network visualization is an indispensable tool for exploring and communicating patterns in complex systems. Netwulf offers an ultra-simple API for reproducible interactive visualization of networks directly from a Python prompt or Jupyter notebook. As a research tool, its purpose is to allow hassle-free quick interactive layouting/styling for communication purposes.
Showing allitems