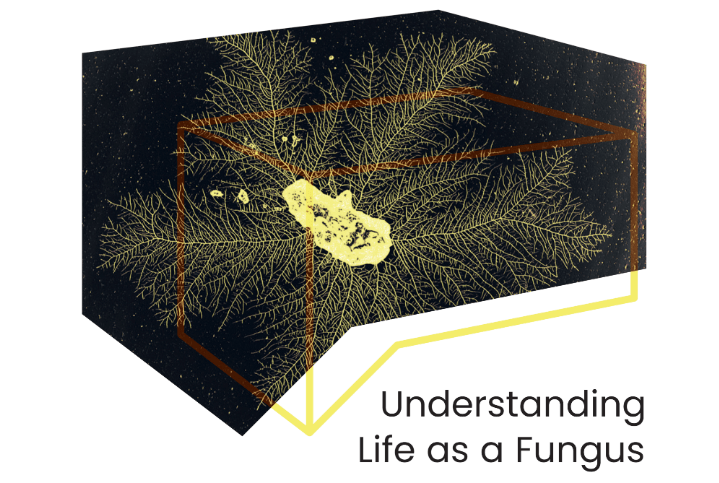
Understanding Life as a Fungus
Published dateJuly 20, 2024
Fungi grow by extending microscopic threads called hyphae, forming intricate networks known as mycelium. Without eyes, brains, or centralized control, they explore their environment with surprising intelligence. This exhibit transforms time-lapse imagery of fungal growth into visual datasets, revealing diverse growth patterns—from geometric structures to chaotic spirals. By studying these behaviors, we aim to uncover how fungi experience the world and how their strategies might inspire innovations in smart materials and transport systems.